Category: SOC - SIEM - Splunk - Qradar
What is SIEM?
- SIEM stands for Security Information and Event Management system. It is a tool that collects data from various endpoints/network devices across the network, stores them at a centralized place, and performs correlation on them.
- Security Information and Event Management system that is used to aggregate security information in the form of logs, alerts, artifacts and events into a centralized platform that would allow security analysts to perform near real-time analysis during security monitoring.
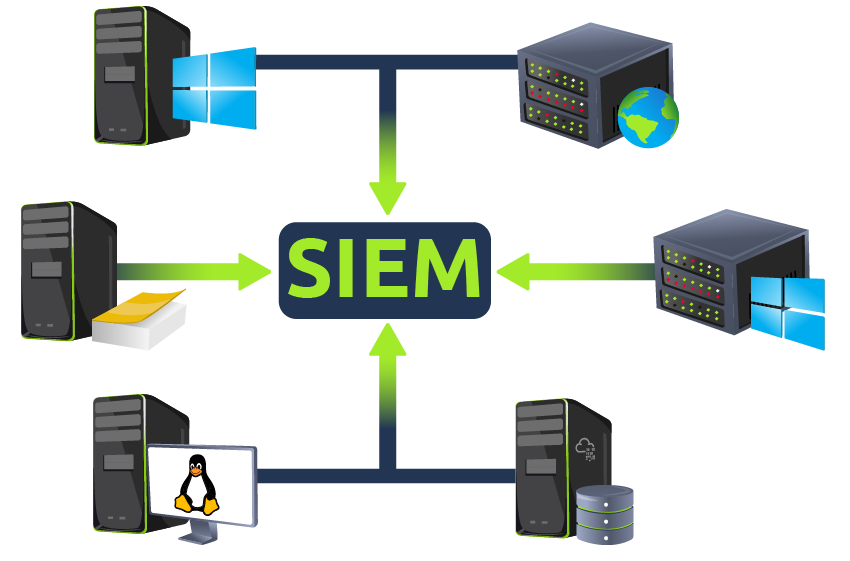
Before explaining the importance of SIEM, let’s first understand why it is critical to have better visibility of all the activities within a network. The image below shows an example of a simple network that comprises multiple Linux/Windows based Endpoints, one data server, and one website. Each component communicates with the other or accesses the internet through a router.
 |
|---|
| Network |
As we know, each network component can have one or more log sources generating different logs. One example could be setting up Sysmon along with Windows Event logs to have better visibility of Windows Endpoint.
We can divide our network log sources into two logical parts:
1. Host-Centric Log Sources
These are log sources that capture events that occurred within or related to the host. Some log sources that generate host-centric logs are Windows Event logs, Sysmon, Osquery, etc. Some examples of host-centric logs are:
- A user accessing a file
- A user attempting to authenticate.
- A process Execution Activity
- A process adding/editing/deleting a registry key or value.
- Powershell execution
2. Network-Centric Log Sources
Network-related logs are generated when the hosts communicate with each other or access the internet to visit a website. Some network-based protocols are SSH, VPN, HTTP/s, FTP, etc. Examples of such events are:
- SSH connection
- A file being accessed via FTP
- Web traffic
- A user accessing company’s resources through VPN.
- Network file sharing Activity
Importance of SIEM
Now that we have covered various types of logs, it’s time to understand the importance of SIEM. As all these devices generate hundreds of events per second, examining the imglogs on each device one by one in case of any incident can be a tedious task. That is one of the advantages of having a SIEM solution in place. It not only takes logs from various sources in real-time but also provides the ability to correlate between events, search through the logs, investigate incidents and respond promptly.
Some key features provided by SIEM are:
- Real-time log Ingestion
- Alerting against abnormal activities
- 24/7 Monitoring and visibility
- Protection against the latest threats through early detection
- Data Insights and visualization
- Ability to investigate past incidents.
Log Sources and Log Ingestion
Every device in the network generates some kind of log whenever an activity is performed on it, like a user visiting a website, connecting to SSH, logging into his workstation, etc. Some common devices that are found in a network environment are discussed below:
Windows Machine
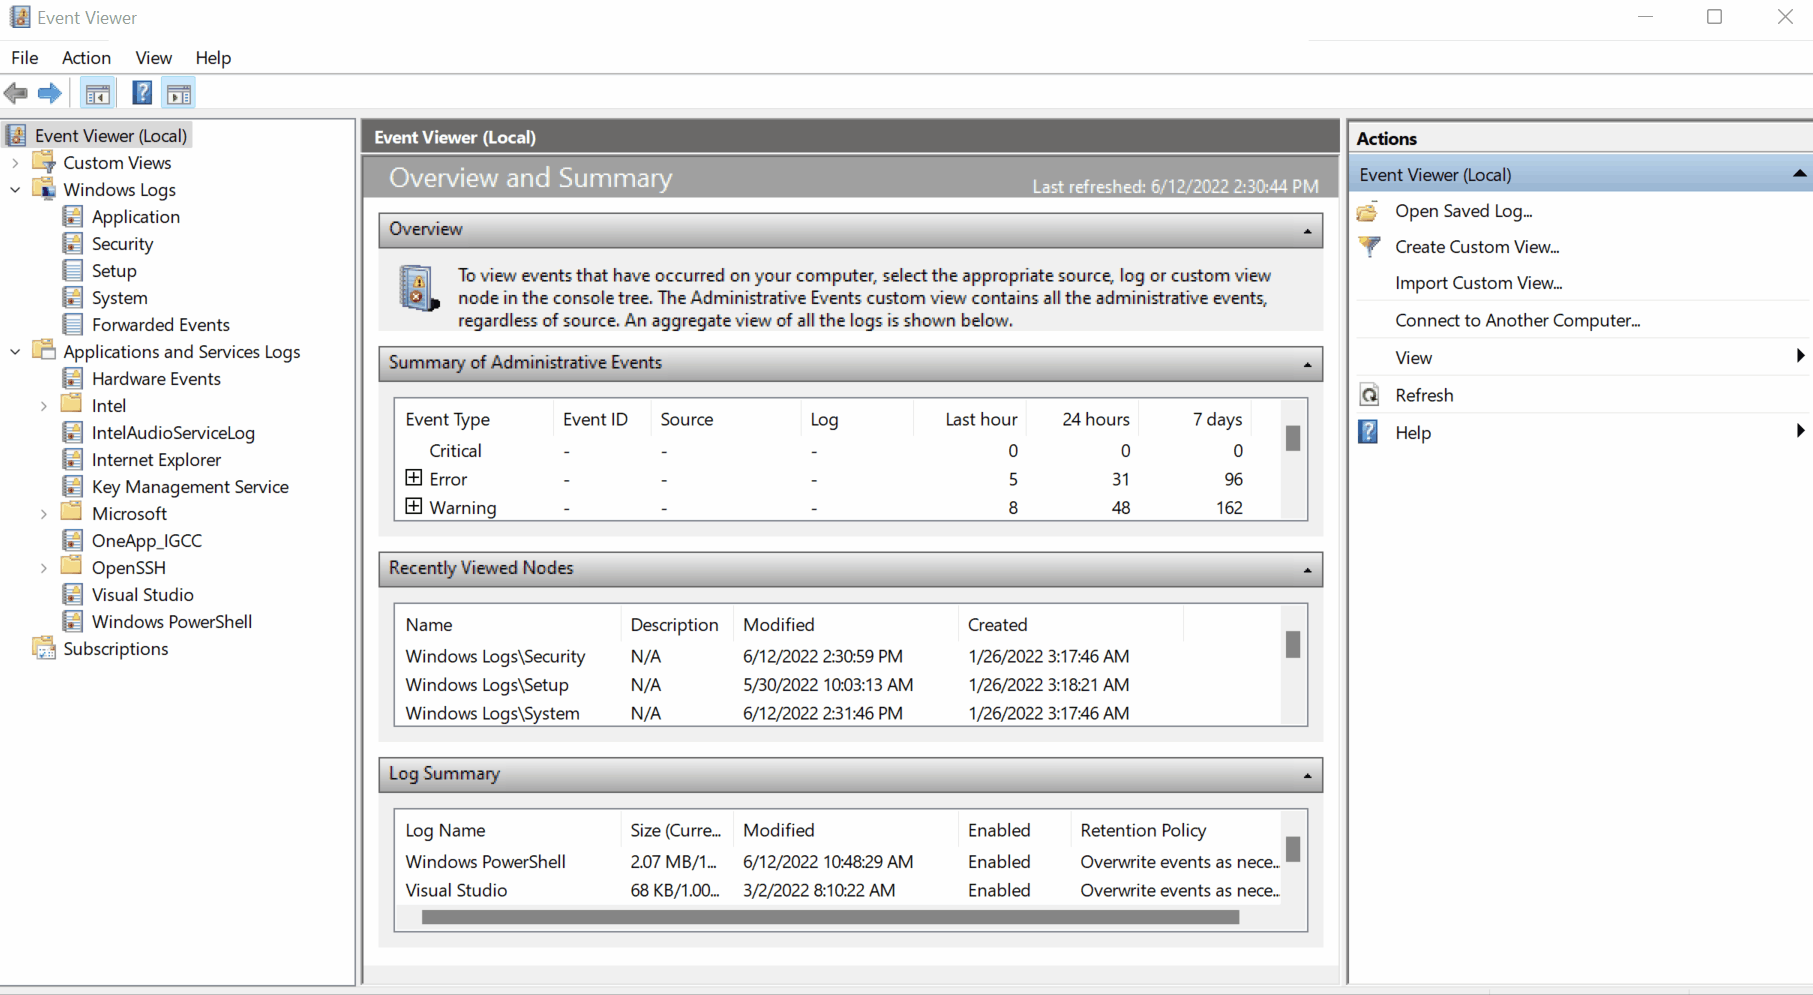
Windows records every event that can be viewed through the Event Viewer utility. It assigns a unique ID to each type of log activity, making it easy for the analyst to examine and keep track of. To view events in a Windows environment, type Event Viewer in the search bar, and it takes you to the tool where different logs are stored and can be viewed, as shown below. These logs from all windows endpoints are forwarded to the SIEM solution for monitoring and better visibility.
Linux Workstation
Linux OS stores all the related logs, such as events, errors, warnings, etc. Which are then ingested into SIEM for continuous monitoring. Some of the common locations where Linux store logs are:
- /var/log/httpd : Contains HTTP Request / Response and error logs.
- /var/log/cron : Events related to cron jobs are stored in this location.
- /var/log/auth.log and /var/log/secure : Stores authentication related logs.
- /var/log/kern : This file stores kernel related events.
Here is a sample of a cron log:
May 28 13:04:20 ebr crond[2843]: /usr/sbin/crond 4.4 dillon's cron daemon, started with loglevel notice
May 28 13:04:20 ebr crond[2843]: no timestamp found (user root job sys-hourly)
May 28 13:04:20 ebr crond[2843]: no timestamp found (user root job sys-daily)
May 28 13:04:20 ebr crond[2843]: no timestamp found (user root job sys-weekly)
May 28 13:04:20 ebr crond[2843]: no timestamp found (user root job sys-monthly)
Jun 13 07:46:22 ebr crond[3592]: unable to exec /usr/sbin/sendmail: cron output for user root job sys-daily to /dev/null
Web Server
It is important to keep an eye on all the requests/responses coming in and out of the webserver for any potential web attack attempt. In Linux, common locations to write all apache related logs are /var/log/apache or /var/log/httpd.
Here is an example of Apache Logs:
192.168.21.200 - - [21/March/2022:10:17:10 -0300] "GET /cgi-bin/try/ HTTP/1.0" 200 3395
127.0.0.1 - - [21/March/2022:10:22:04 -0300] "GET / HTTP/1.0" 200 2216
Log Ingestion
All these logs provide a wealth of information and can help in identifying security issues. Each SIEM solution has its own way of ingesting the logs.
Some common methods used by these SIEM solutions are explained below:
- Agent / Forwarder: These SIEM solutions provide a lightweight tool called an agent (forwarder by Splunk) that gets installed in the Endpoint. It is configured to capture all the important logs and send them to the SIEM server.
- Syslog: Syslog is a widely used protocol to collect data from various systems like web servers, databases, etc., are sent real-time data to the centralized destination.
- Manual Upload: Some SIEM solutions, like Splunk, ELK, etc., allow users to ingest offline data for quick analysis. Once the data is ingested, it is normalized and made available for analysis.
- Port-Forwarding: SIEM solutions can also be configured to listen on a certain port, and then the endpoints forward the data to the SIEM instance on the listening port.
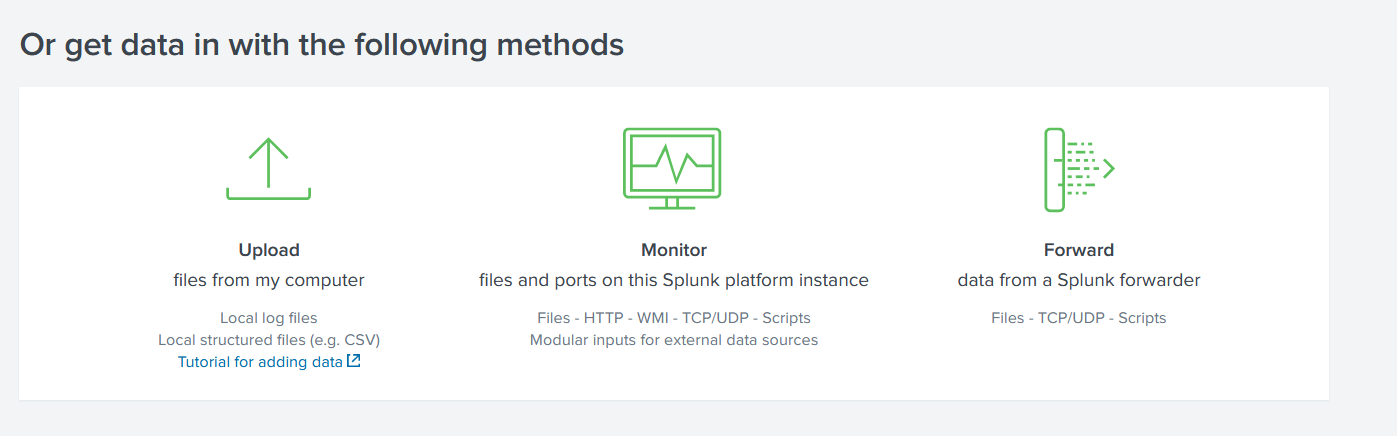
An example of how Splunk provides various methods for log Ingestion is shown below:
Why SIEM?
SIEM is used to provide correlation on the collected data to detect threats. Once a threat is detected, or a certain threshold is crossed, an alert is raised. This alert enables the analysts to take suitable actions based on the investigation. SIEM plays an important role in the Cyber Security domain and helps detect and protect against the latest threats in a timely manner. It provides good visibility of what’s happening within the network infrastructure.
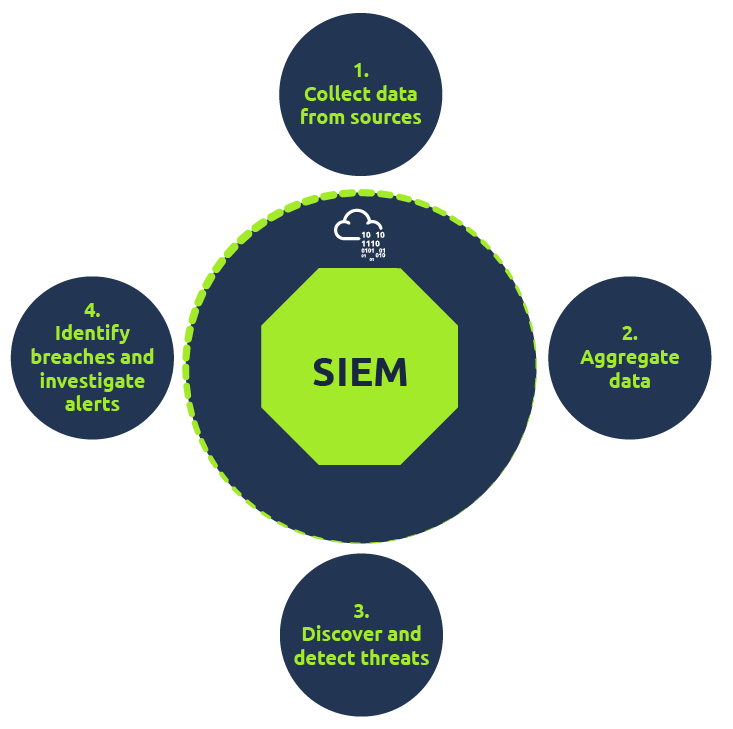
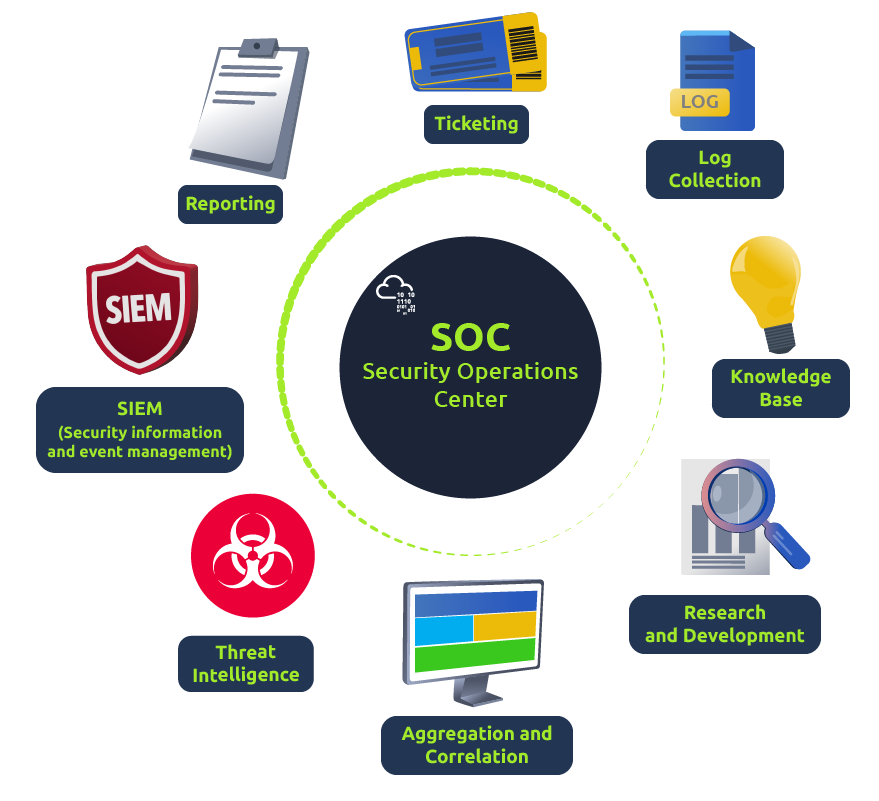
SIEM Capabilities
SIEM is one major component of a Security Operations Center (SOC) ecosystem, as illustrated below. SIEM starts by collecting logs and examining if any event/flow has matched the condition set in the rule or crossed a certain threshold
Some of the common capabilities of SIEM are:
- Correlation between events from different log sources.
- Provide visibility on both Host-centric and Network-centric activities.
- Allow analysts to investigate the latest threats and timely responses.
- Hunt for threats that are not detected by the rules in place.
SOC Analyst Responsibilities
SOC Analysts utilize SIEM solutions in order to have better visibility of what is happening within the network. Some of their responsibilities include:
- Monitoring and Investigating.
- Identifying False positives.
- Tuning Rules which are causing the noise or False positives.
- Reporting and Compliance.
- Identifying blind spots in the network visibility and covering them.
Analysing Logs and Alerts
SIEM tool gets all the security-related logs ingested through agents, port forwarding, etc. Once the logs are ingested, SIEM looks for unwanted behavior or suspicious pattern within the logs with the help of the conditions set in the rules by the analysts. If the condition is met, a rule gets triggered, and the incident is investigated.
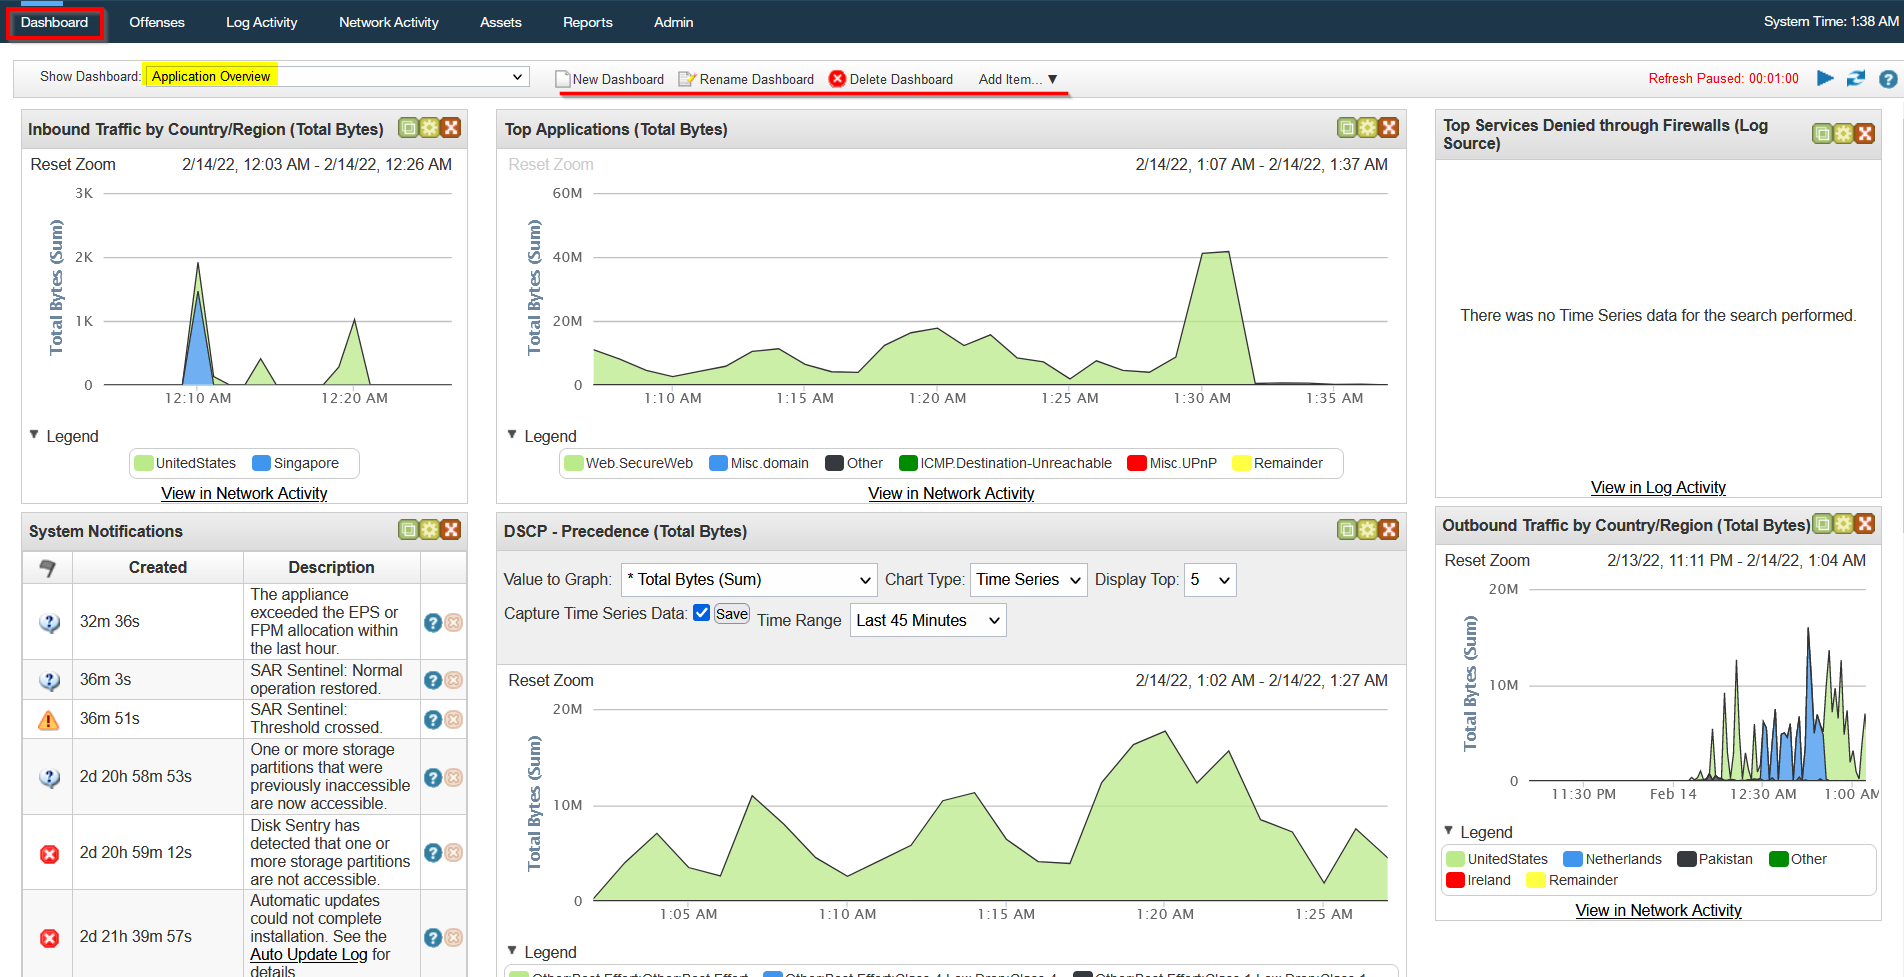
Dashboard
Dashboards are the most important components of any SIEM. SIEM presents the data for analysis after being normalized and ingested. The summary of these analyses is presented in the form of actionable insights with the help of multiple dashboards. Each SIEM solution comes with some default dashboards and provides an option for custom Dashboard creation. Some of the information that can be found in a dashboard are:
- Alert Highlights
- System Notification
- Health Alert
- List of Failed Login Attempts
- Events Ingested Count
- Rules triggered
- Top Domains Visited
An example of a Default dashboard in Qradar SIEM is shown below:
 |
|---|
| Qradar SIEM |
Correlation Rules
Correlation rules play an important role in the timely detection of threats allowing analysts to take action on time. Correlation rules are pretty much logical expressions set to be triggered. A few examples of correlation rules are:
- If a User gets 5 failed Login Attempts in 10 seconds - Raise an alert for Multiple Failed Login Attempts
- If login is successful after multiple failed login attempts - Raise an alert for Successful Login After multiple Login Attempts
- A rule is set to alert every time a user plugs in a USB (Useful if USB is restricted as per the company policy)
- If outbound traffic is > 25 MB - Raise an alert to potential Data exfiltration Attempt (Usually, it depends on the company policy)
How a correlation rule is created
To explain how the rule works, consider the following Eventlog use cases:
Use-Case 1:
Adversaries tend to remove the logs during the post-exploitation phase to remove their tracks. A unique Event ID 104 is logged every time a user tries to remove or clear event logs. To create a rule based on this activity, we can set the condition as follows:
Rule: If the Log source is WinEventLog AND EventID is 104 - Trigger an alert Event Log Cleared
Use-Case 2:
Adversaries use commands like whoami after the exploitation/privilege escalation phase. The following Fields will be helpful to include in the rule.
- Log source: Identify the log source capturing the event logs
- Event ID: which Event ID is associated with Process Execution activity? In this case, event id 4688 will be helpful.
- NewProcessName: which process name will be helpful to include in the rule?
Rule: If Log Source is WinEventLog AND EventCode is 4688, and NewProcessName contains whoami, then Trigger an ALERT WHOAMI command Execution DETECTED
In the previous task, the importance of field-value pairs was discussed. Correlation rules keep an eye on the values of certain fields to get triggered. That is the reason why it is important to have normalized logs ingested.
Alert Investigation
When monitoring SIEM, analysts spend most of their time on dashboards as it displays various key details about the network in a very summarized way. Once an alert is triggered, the events/flows associated with the alert are examined, and the rule is checked to see which conditions are met. Based on the investigation, the analyst determines if it’s a True or False positive. Some of the actions that are performed after the analysis are:
- Alert is False Alarm. It may require tuning the rule to avoid similar False positives from occurring again.
- Alert is True Positive. Perform further investigation.
- Contact the asset owner to inquire about the activity.
- Suspicious activity is confirmed. Isolate the infected host.
- Block the suspicious IP.
Protect Your Digital Presence & Stay Cyber Safe 💙
Thanks🌸